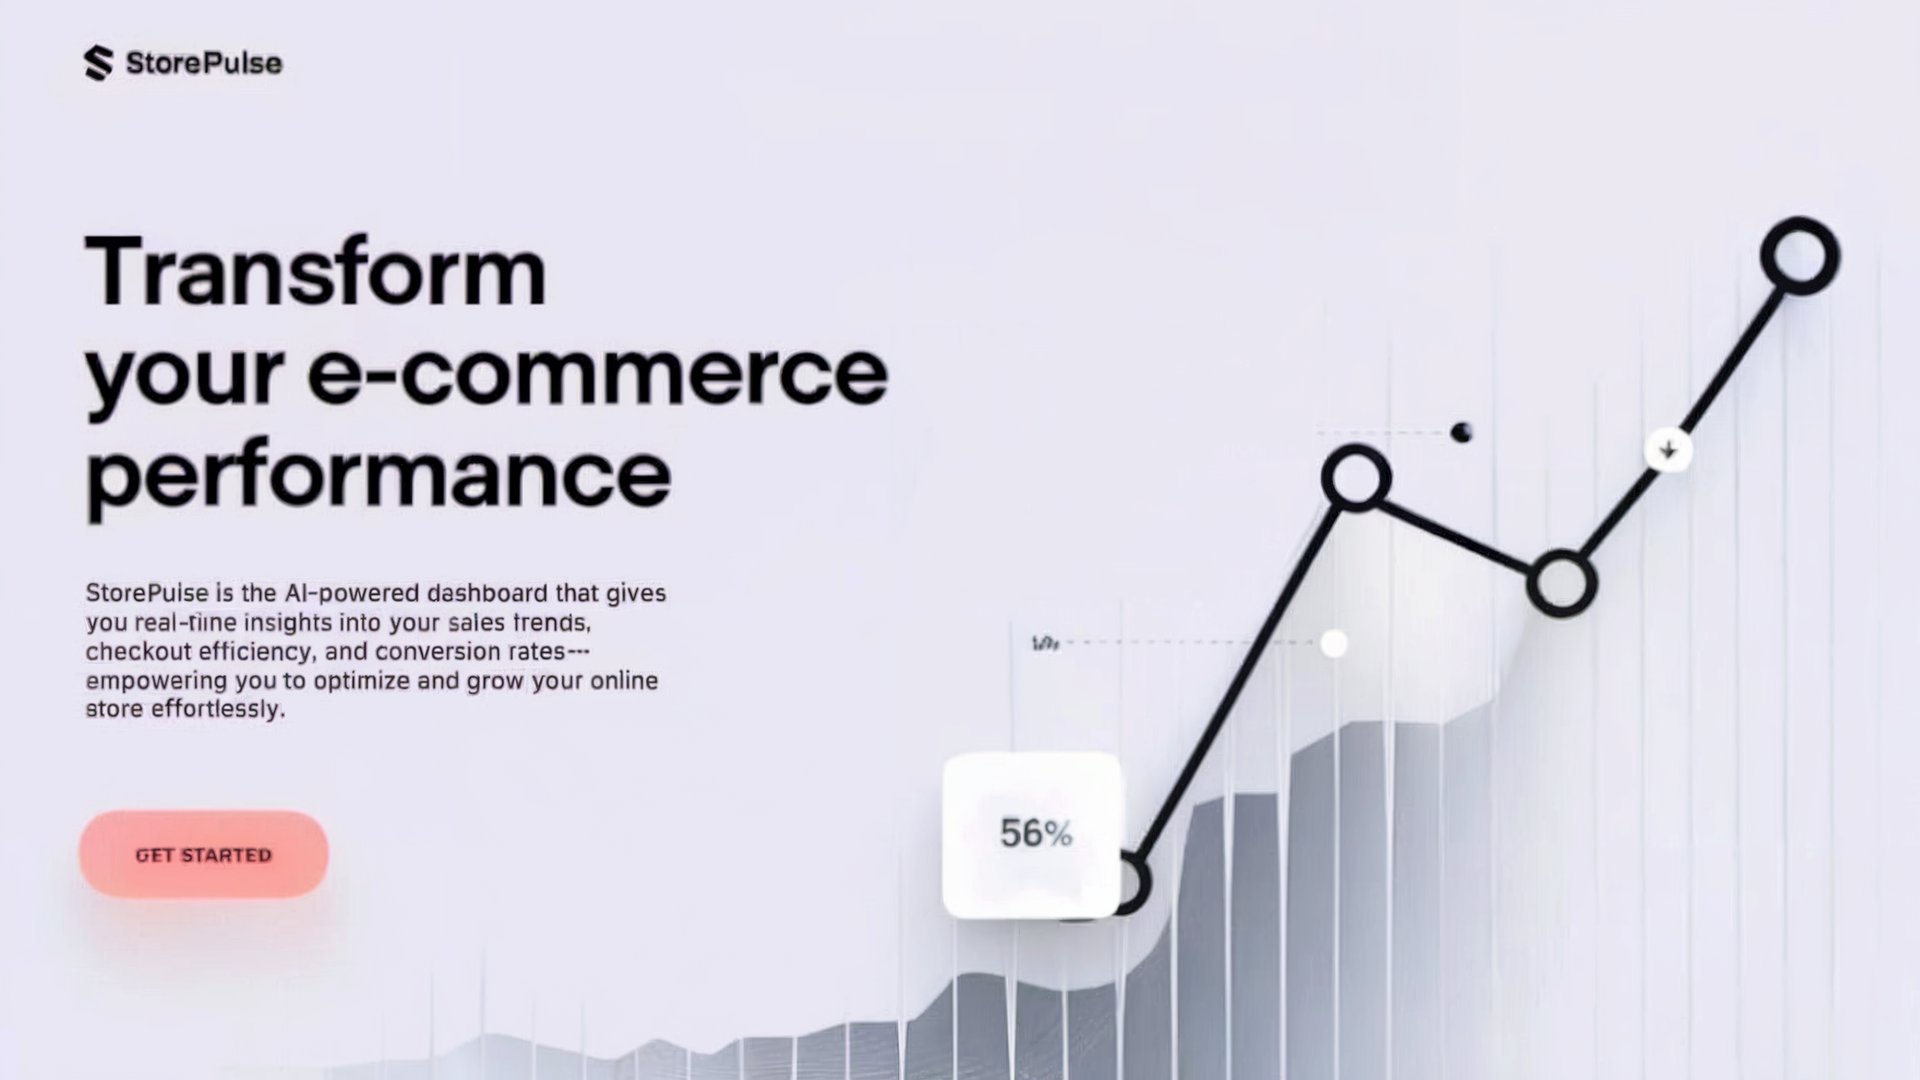
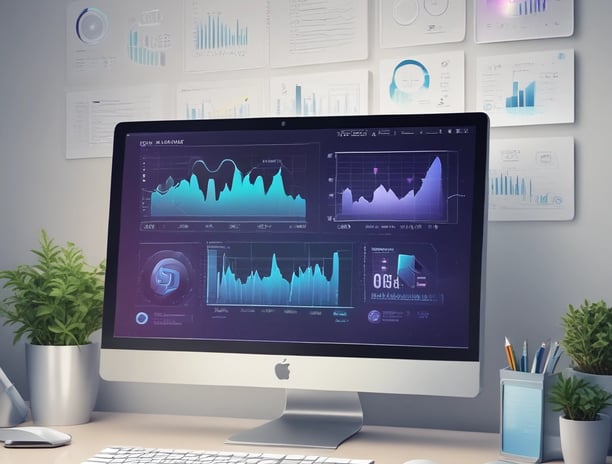
Performance Monitoring Tools
Optimize your e-commerce success with real-time insights on sales trends and conversion rates.

Real-Time Insights & Automated Triggers
Stay ahead of the curve with up-to-the-minute insights into your store’s performance. Our system automatically detects shifts—such as a spike in cart abandonment or a drop in conversions—and triggers instant alerts, empowering you to act quickly
StorePulse offers a powerful suite of performance monitoring tools designed to elevate your e-commerce experience. Our intuitive dashboard provides real-time insights into essential sales trends, conversion rates, and key metrics that matter most to online store owners. Whether you're tracking daily performance or analyzing long-term patterns, the simplicity and clarity of our data presentation make it easy to understand. With actionable insights at your fingertips, you can swiftly identify opportunities for improvement and optimize your business strategies. Let StorePulse empower you to make informed decisions and drive your online store's success with confidence.
StorePulse Process
Seamlessly integrate StorePulse with your e-commerce platform to aggregate and analyze critical data. Our dashboard offers real-time analytics, automated alerts, and customizable views, ensuring you have the precise insights needed to optimize operations and boost revenue.


Easy Integration
Connect StorePulse with your e-commerce platform seamlessly for instant data access.
Data Aggregation
Gather real-time data from various sources to enhance your business insights.
AI-Driven Alerts
Receive timely notifications about critical changes in your e-commerce performance.
Key Features Overview
Discover how StorePulse transforms e-commerce with innovative analytics and actionable insights.


Real-Time Analytics
Monitor sales and conversions instantly for informed decision-making.
Automated Alerts
Receive timely notifications for performance changes to stay ahead.
Customizable Dashboards
Tailor your insights to focus on metrics that matter most to you.
Performance Monitoring Tools
Optimize your e-commerce success with real-time insights on sales trends and conversion rates.


Real-Time Insights
Real-time insights provide up-to-the-minute analytics on your store’s performance, enabling you to monitor trends and detect issues as they occur. By integrating these live metrics into efficient workflows, you can swiftly pivot your strategy when needed
Automated Triggers
Automated triggers are event-based actions that automatically initiate tasks when specific conditions are met, eliminating the need for constant manual oversight. In an e-commerce setting, these triggers can detect shifts in key metrics—like a spike in cart abandonment or a dip in conversion rates—and promptly alert you or kick off remedial workflows

StorePulse transformed our sales strategy, leading to a 30% increase in revenue within three months.
Alex R.

Thanks to StorePulse, our conversion rates improved significantly, making our workflow more efficient and streamlined.
Jamie L.

★★★★★
★★★★★
Unlock Your E-Commerce Potential
Hear from e-commerce owners who have revolutionized their businesses with StorePulse. Our users consistently report enhanced conversion rates, streamlined workflows, and a significant boost in revenue—testimony to the power of real-time, actionable insights.


150+
15
Trusted by Experts
Proven Success

Ready to transform your store?
Unlock your store's potential with StorePulse—simple and risk-free to get started today!
Rated 5 stars by users.
★★★★★
About Storepulse
At StorePulse, our mission is to empower e-commerce owners with cutting-edge, AI-driven insights that simplify performance management. We are dedicated to fostering innovation, transparency, and measurable success in online retail through our powerful analytics platform.


Our Mission
At Storepulse, we strive to deliver a sleek, modern dashboard that drives growth and efficiency, making e-commerce management more intuitive and effective.

Get in Touch
Reach out for inquiries or support regarding StorePulse services.